Bit error ratios (BERs, sometimes called bit error rates) measure the ratio of incorrectly received bits in a data stream to the total number of bits in the stream. BERs are an unfortunate fact of life for digital and communication system designers and can be minimized and controlled, but not eliminated. BERs are related to packet error rates (PERs). The PER is the ratio of incorrectly received data packets to the total number of received packets. A packet is declared incorrect if at least one bit is erroneous.
This FAQ starts by defining BERs, looks at sources of BERs in copper and fiber optic links, correcting BERs with error correcting codes, reviews how BERs relate to the noise floor and presents how BER testers (BERTs) and BER confidence intervals work, and closes with a practical example of using BERs in direct-to-satellite (DtS) communication networks.
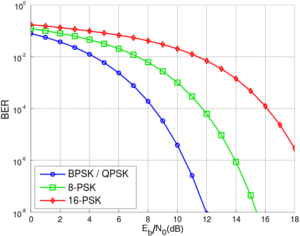
BERs are one of the most important measures of digital transmission quality. The BER of a system is determined by comparing the transmitted bit sequence with the received sequence, counting the errors, and calculating the ratio of the number of bits received in error over the total number of bits in the stream. BERs can be affected by external factors like signal-to-noise ratios (SNRs) and internal system performance related to signal distortion, jitter, and so on. In noisy channels, BER can be expressed in terms of the energy per bit to noise power spectral density ratio, the normalized carrier-to-noise ratio, Eb/N0 in dB (Figure 1). In optical systems, BER versus received power in dBm is used and in wireless communication, BER versus SNR is common.

Practical BERs for serial links can range from 10-6 to 10-15. BERs can be mitigated, and a virtually error-free transmission achieved, by detecting and correcting bit errors using techniques like checksums.
BERs are simply a ratio of the number of bits sent and received that don’t correlate with any period of time. When related to a specific time period, a BER can produce a mean time between failure (MTBF) for a serial link: MTBF(hours) = (BER x bits/hour)-1
BERs are also important in optical data transmission links. Sources of fiber optic transmission BERs include imperfections in the receiver, the transmitter, amplifiers, and optical losses and dispersion. Various sources of nonlinearities can also cause signal distortion and crosstalk that results in BERs. Depending on the source of the BERs, possible solutions include increasing the transmitted power, using fibers with lower propagation losses, adding electronic dispersion compensation, reducing the data rate, or optimization of wavelength channels in a wavelength division multiplexing system.
BER and the noise floor
The noise floor is one factor that sets the minimum possible BER for RF communications. It’s the ambient RF power in the spectrum of interest. Information about the noise floor for an application is important when modeling BERs, and is related to the anticipated SNR. A lower SNR will have a higher BER. The closer the signal level is to the noise floor, the more unpredictable the BER can become. The noise floor is impacted by factors like location, frequency, temperature, and bandwidth:
Location – Human activities are the most common source of noise. Since there are more human activities in urban settings, there’s also a higher noise floor there. Rural and remote locations have lower noise floors while suburban areas have intermediate levels. For a popular band like 2.4 GHz, the difference in the noise floor between urban and rural locations can be over 6 dB. The noise floor can also vary from country to country since governments regulate spectrum usage differently.
Frequency – The anticipated noise floor is also frequency dependent. Unlicensed bands like 2.4 GHz tend to have higher levels of activity and higher noise floors. Licensed bands tend to have less activity; the more tightly regulated the band, the lower the noise floor tends to be. The noise floor difference between licensed and unlicensed bands can be several dB.
Temperature – While human-caused noise is not uniformly spread over the spectrum thermal noise tends to have a uniform distribution. Thermal noise increases at higher temperatures. Thermal noise is usually a second-order consideration and only varies by about 1 dB between a hot and cold day or location with more noise on hot days or in hot climates.
Bandwidth – Boltzmann’s Constant can be used to calculate the relationship between bandwidth and noise power. For example, using decibel meters (dBm), the noise floor is -114 dBm + 10 Log (bandwidth in MHz).
BER and BERTs
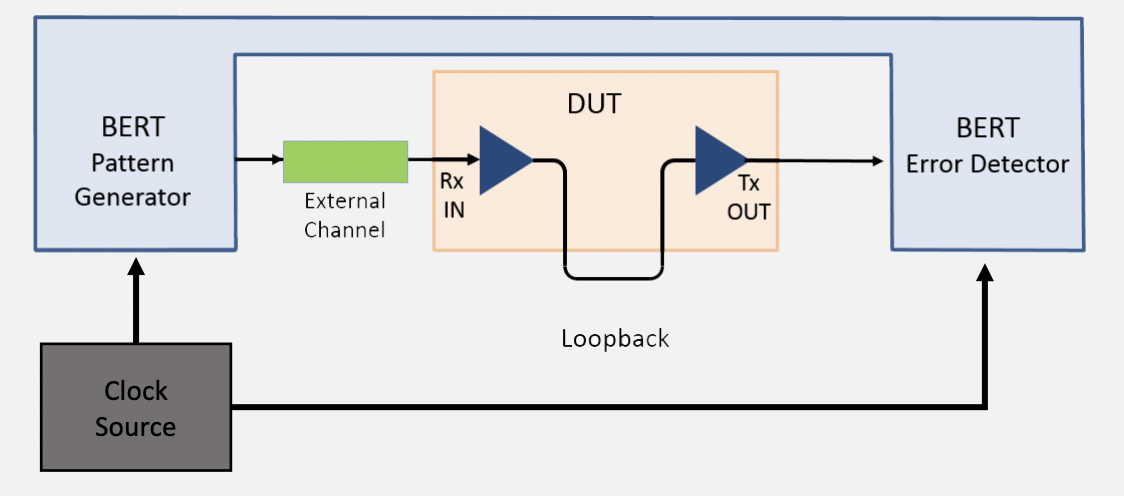
BERs are measured using bit error ratio testers (BERTs). BERTs are often used when designing application-specific integrated circuits (ASICs), RF ICs, components, modules, high-speed communications ports, and line cards. Typical applications that benefit from using a BERT include computers, storage, communication, medical, and military systems. BERTs are used for characterization, design verification, compliance, and manufacturing test. A BERT consists of a pattern generator, a clock source, and an error detector (Figure 2).

The pattern generator transmits a defined bit pattern to the device under test (DUT). Pattern generators are available that operate from several kHz up to multi-GHz. The clock source synchronizes the pattern generator and the error detector. BERTs require very accurate time bases. Some units include internal clocks, and some operate with externally supplied clock signals. Factors like jitter can interfere with accurate measurements and the data stream, and the clock signal must be precisely aligned. The error detector produces an exact copy of the bit stream sent by the pattern generator and compares the two on a bit-by-bit basis. In addition, the error detector needs to be able to distinguish between filler symbols inserted by protocols like USB and PCIe and the actual test pattern. BER measurements are only an estimate based on probabilities and confidence intervals.
How confident are you?
BERTs are used to produce a statistical estimate of the true BER. Reaching 100% confidence in the BER estimate requires an infinite number of tests. By repeatedly transmitting N bits with E errors k times, it’s possible to determine BER (E/N) to a desired confidence level (CL). CL x 100 is the percentage of confidence that the true BER (with N = infinity) is less than the specified (or measured) system BER (BERS) using k measurement points. It can be calculated based on a Poisson distribution as:

In practical design cases, it’s only necessary to test if the BER is less than a specific threshold. The number of bits needed to realize that result depends on the needed CL and the BER threshold. All industry standards specify a maximum permissible BERS, but not necessarily the confidence level. The required confidence level is included in some industry standards, but when it’s not specified, the use of a 95% confidence level is considered good practice.
Direct to satellite BERs
Direct-to-satellite (DtS) communication is increasingly being used for local and global IoT networks. Reconfigurable intelligent surfaces (RIS) have been proposed to perform functions like beamforming, tracking, and equalization to optimize system performance and minimize energy consumption. RIS implementations rely on estimates of channel state information (CSI). Given the random nature of the environment and propagation medium, neural networks and inductive learning have been proposed for providing CSI estimates. One technique involves the use of graph attention (GAT) networks for channel estimation.

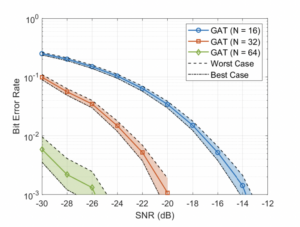
The BER performance of the proposed RIS system is a critical factor in the DtS IoT system. The GAT estimator was used for estimating the CSI and combined with the BER analysis for systems of 16, 32, and 64 RIS elements. The expected BER performance using GAT estimators is nearly the same as a perfect estimator at low SNR. As the SNR increases, there is a slight degradation in the BER performance resulting from the imperfect nature of the GAT estimations. Additionally, larger numbers of RIS elements result in wider confidence ranges due to the less accurate GAT CSIs (Figure 3).
Summary
BERs are important factors in the performance of a range of electronic systems including computing, communications, medical, military and autonomous transportation. In addition to system design, environmental factors like location, frequency, bandwidth and temperature impact PER performance. BERs are measured using BERTs that provide a statistical estimate of the expected BER value. BET confidence levels of 95% are usually considered adequate for most applications.
References
BER Confidence-level Calculator, SiTime
Bit Error Rate, Wikipedia
Graph Attention Networks for Channel Estimation in RIS-assisted Satellite IoT Communications, ResearchGate
How Do I Measure the Bit Error Rate (BER) to a Given Confidence Level, Keysight
Modelling the Bit Error Rate (BER), CloudRF
Understanding Bit-Error-Rate, Infineon
What is a Bit Error Ratio Tester?, Keysight


