The signal strength of automotive radar can be estimated from the target radar cross section and distance.
Greg Lee, Keysight Technologies
Sir Robert Watson-Watt is generally credited as radar’s inventor, having developed the first practical system in 1935 and later applying radar to aircraft and weather. We’ve since used radar to monitor everything from ballistic missiles to bird migration. Automotive radar is a recent technology which may provide safer driving, perhaps even autonomously. In that regard, recent improvements upon a historic radar signal strength formula allow it to be more generally applicable to automotive applications.
In nearly all nonautomotive contexts, a simple formula predicts the return signal strength:
Pr/Pt = σGrGtλ2/(4π)3R4 Eqn. (1)
where Pr and Pt are the received and transmitted power, W; σ is the target radar cross section (RCS); Gr and Gt are the receive and transmit antenna gains, unitless; λ is the wavelength, m; and R is the distance between radar and target, m. σ has units of area, but is usually reported in dBsm, decibels relative to 1 m2.
Intuitively, this classic radar signal formula is just the roundtrip (two-way) generalization of the famous Friis’ formula for one-way broadcast. To see this, let us first note that RCS is not the physical projected area Aeff of the target object. Instead, for a perfectly reflecting object, the RCS is given by
σ = 4πAeff2/λ2 = GobjAeff Eqn. (2)
where we have used the relationship between antenna gain and area Gobj = 4πAeff/λ2 between gain and area. Namely, we can think of the target object as a passive transponder that receives the incident radiation with an effective capture area Aeff and retransmits it with an (object) antenna gain Gobj. This makes perfect sense because RCS is defined as the (direction-dependent) equivalent isotropic scattered power divided by the incident planewave intensity.
It is well known that Friis’ formula is strictly valid only when the transmitter and receiver are mutually in each other’s far field. Fraunhofer diffraction hasn’t fully developed at close distances, so the 1/R2 power-versus-distance dependence flattens out. Likewise, it is appreciated that Eqn. (1) is invalid when the target lies in the near field of the radar. Much less appreciated is the reciprocal (mutual) validity requirement that the radar must also lie in the far field of the target object, but this logically follows from our consideration of the target as a transponder in the preceding paragraph.
Automotive radars, working in either the 24 or 76-81 GHz bands, detect targets at ranges up to ~300 m (in some cases up to ~1 km) and down to less than a meter. Engineers designing or using these sensors must be careful not to apply the classic radar formula Eqn. (1) unconditionally. As an example, consider a delivery truck whose rear is 2-m wide by 3-m high, so Aeff = 6 m2. λ = 3.9 mm at 77 GHz, so if the rear surface were a perfectly flat mirror, the RCS should be 75 dBsm. Reported 77 GHz RCSs for cars and trucks are 20-45 dBsm, implying considerable wide-angle scattering rather than retroreflection. For arguments sake, let us take 40 dBsm as the trucks RCS, Gr = Gt = 15 dB, and R = 0.5 m. Then Eqn. (1) predicts the radar receives 22% more power that it transmits, clearly impossible. If the truck’s rear had been a perfectly flat mirror, Eqn. (1) would have predicted 35 dB of roundtrip gain – the world’s energy problems would be solved!
What is wrong? The most obvious problem in the calculation is the truck is so close that most of its rear isn’t even illuminated by the radar. For the stated radar antenna gains and distance, only about 1% of the truck’s rear lies within the radar’s field of view (FOV).
In the real driving world, there is also considerable signal strength variability. This variability arises from several factors including ground bounce, object orientation, and polarization effects. Ground bounce is the classic example of multipath propagation which can result in either a 6 dB increase or deep fading, depending on whether the direct and bounce paths constructively or destructively interfere with each other. The interference versus range even has subtle polarization dependence.
Only spheres have orientation-independent RCS. Cars, trucks, bicycles, and pedestrians will all present different σs depending on what view they present the radar. Because the wavelength is so short at 77 GHz, even small changes in orientation can shift the effective retroreflecting zones in any of these classes of objects. This causes not only variation in signal strength, but also angular shifts of sub-object detections in the case of modern imaging radars.
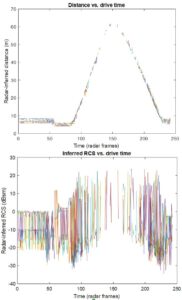
Both the mean estimation error when misapplying Eqn. (1) and the signal strength variation can be appreciated by a simple experiment Keysight performed in an empty parking lot. A commercial 77-GHz automotive radar with a far field of about one or two meters was fixed in the parking lot; a car (Volkswagen Golf) was at first parked, then slowly driven away from the radar, then put in reverse and backed up, and finally re-parked. A nearby figure shows the reported range and RCS of the car as a function of recorded time.
First, notice the ±10 to ±20 dB fluctuations in the RCS. These arise from the factors noted above and perhaps others. Second, the mean perceived RCS is about 10 dBsm when the car is 60 m from the radar but drops to about -10 dBsm when it is 5-8 m away.
Of course, the car has neither shrunk nor donned cloaking material when it is closer to the radar. The radar software has simply misapplied Eqn. (1) to convert roundtrip received signal efficiency to RCS at distances where the radar is no longer in the far field of the car, leading to a perceived RCS that falls dramatically as distance shrinks. This dramatic falloff in reported RCS is problematic because it can lead to misclassification of objects – for example, the car might be reclassified as a pedestrian.
We now suggest a pragmatic improvement to Eqn. (1) suitable for automotive radar applications. What is needed is a formula (or formulas) which reduce to Eqn. (1) at large distances but capture the notion of incipient (rather than fully developed) diffraction at closer distances. We can think of the Fraunhofer or Rayleigh ranges of the target object and of the radar itself as distance breakpoints, but it is better to employ differentiable functions. That is, a more realistic representation of the expected return signal strength, disregarding fluctuations for the moment, should feature the Fraunhofer-Rayleigh far field distances as soft transitions.
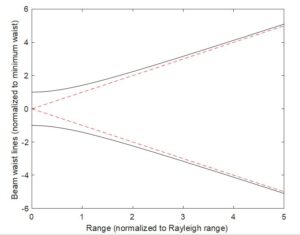
Such a soft breakpoint formula presents itself in the theory of Gaussian beams. A nearby figure illustrates how diffraction is elegantly represented by the hyperbolic “blooming” of a Gaussian beam.
Due to conservation of total propagating power, intensity on the beam axis at any range is inversely proportional to the square of the beam waist (that is, beam diameter) at that range. Because the beam-waist-vs.-range curve is a hyperbola, intensity varies with distance from the focal plane as 1/(R2+RR2), where RR is the beam’s Rayleigh range given essentially by the focal spot area divided by λ. (One can quibble about a factor of two, but it is beyond the scope of this article to discuss such matters.) For R >> RR, one recovers the usual 1/R2 dependence predicted by Friis, as seen from the linear waist growth vs. range at large R. Conversely, for R << RR one has nearly constant intensity since one is so near the focal plane that diffraction loss is minor – the waist remains nearly constant at these distances.
How should we generalize the simple, attractive Gaussian beam idea to radar? Two extreme situations of roundtrip propagation can constrain candidate approximate formulas. The first ideal scenario is when the target object is a large retroreflecting mirror. The second is when the target is still a mirror but now is smaller than the radar itself.
In the first scenario, when the mirror object is close enough, a Gaussian beam emanating from the radar will bounce off the mirror and continue to diverge on its return path. For example, the radar receives a wave whose spatial profile is that of a Gaussian beam which has travelled 2R from its focal plane. Based on this observation, a simple pragmatic formula for roundtrip signal strength is
Pr/Pt = σGrGtλ2/[(4π)3(R2+Ravg2)(R2+Robj2)] Eqn. (3)
where Ravg is the arithmetic mean of the radar’s transmit and receive Rayleigh ranges, and Robj is the target object’s Rayleigh range. The appearance of Robj in Eqn. (3) is intuitive from our discussion above, but the appearance of Ravg may seem mysterious and so bears elaboration.
As we have emphasized, the radar and the target should mutually be in each other’s far fields for the 1/R4 law to apply. Hence, the appearance of soft breakpoints associated with both radar and target should not surprise. However, one might naively expect that Ravg would be the geometric mean of the radar’s transmitter and receiver Rayleigh ranges, and yet Eqn. (3) features the arithmetic mean. Why so?
The geometric mean is always less than or equal to the arithmetic mean. For example, suppose the transmit Rayleigh range is zero but the receive Rayleigh range is two meters. The geometric mean vanishes but the arithmetic mean is one meter. If we were to bring the large, mirror-like object down to zero distance, using the geometric mean would predict Pr/Pt = infinity, which is physically impossible. Of course, this is the same problem with the classic Eqn. (1), only more so. On the other hand, a little elementary calculus (namely, Gaussian overlap integrals) shows that the arithmetic mean is the correct Rayleigh range to use for the folded Gaussian beam scenario.
In the second scenario where the target object is smaller than the radar, one can think of the target as spatially filtering the incident wave before retroreflecting it. In this case, the target is truly acting like a transponder, so the roundtrip efficiency should simply be a product of two one-way modified Friis factors. The equation we propose is
Pr/Pt = σGrGtλ2/[(4π)3(R2+Rot2)(R2+Ror2)] Eqn. (4)
Here Rot is the arithmetic mean of the transmitter and object Rayleigh ranges, while Ror is the arithmetic mean of the receiver and object Rayleigh ranges. Once again, the arithmetic means arise from Gaussian beam calculus. These mean Rayleigh ranges are what “modify” the one-way factors from being pure Friis-law factors.
Incidentally, when the object has the same Rayleigh range as the transmitter and receiver, Eqn. (4) becomes identical to Eqn. (3). This makes sense, because one should have a continuous transition from “small” to “large” objects.
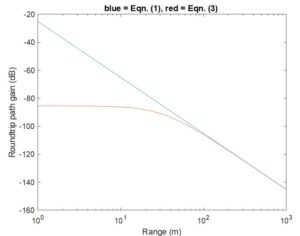
At left, we show a 77 GHz example of the roundtrip signal efficiency using Eqn. (3) and compare with the classic Eqn. (1). Note that whereas Eqn. (1) predicts unbounded increase of Pr/Pt as distance decreases, Eqns. (3) and (4) predict signal strength saturation. The latter is what one physically expects, whereas the former is unphysical, e.g., allowing perpetual motion machines, and is responsible for the drop in perceived RCS with diminishing distance which many automotive radars erroneously report. The latter equations lead to more constant perceived RCS, a highly desirable outcome because it aids in proper object classification, a notoriously difficult task in autonomous driving.
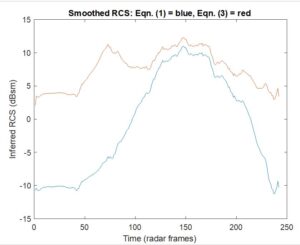
To substantiate this claim, we have smoothed the data from the right-hand portion of Figure 1 and replotted in the figure at left, first without correction and then with correction based on Eqn. (3). Because the product of the radar’s receive and transmit antenna gains happens in both Eqn. (1) and Eqn. (3), there is no need to know these gains in applying the “Rayleigh-based” correction.
Furthermore, the estimated Rayleigh range(s) of the radar is(are) about an order of magnitude less than the minimum range of the car in the experiment, so the only parameter that really matters is the effective Rayleigh range of the car itself. Like many compact hatchbacks, the upper rear of a Volkswagen Golf is slanted, so one expects retroreflection mainly from the lower rear of the chassis and bumper. This suggests a normal-to-beam surface area of perhaps 0.2 m2, commensurate with our parameter choice Robj = 35 m for the radar’s operating frequency of 76.5 GHz.
The RCS variation is about ±10.5 dB without the Rayleigh-based correction, i.e., using Eqn. (1), whereas it drops to about ±4.5 dB with the Rayleigh-based correction, i.e., Eqn. (3). The residual variation in RCS after Rayleigh-range correction may be due to orientation effects. For example, the rear of the car may have been less perpendicular to the radar beam when the inferred RCS dropped below ~5 dBsm.
Finally, when emulating road scenes, the addition of a stochastic term to Eqns. (3) and (4) can help account for the signal strength fluctuations seen in the real world. The standard deviation in decibels of such a term may even be chosen to depend on road conditions, e.g., dry and smooth versus gravelly versus snow-covered, etc. If anisotropic RCS data are available for objects – bicycles/bicyclists come to mind – then target orientation effects can be included into the equations to also improve signal estimation.
All in all, the classic 1/R4 “law” relating radar roundtrip signal strength to target distance and RCS is not really a law at all but rather an approximation. Even discounting real-world road effects such as object orientation, ground bounce multipath, etc., the approximation is only valid at sufficiently large distances. It grossly overpredicts signal strength at close distances; conversely, automotive radar software which misapply the classic formula at close distances will under-predict target RCS. Equations which are more faithful to diffraction physics reduce signal=strength estimation error or conversely RCS error.
Acknowledgments —The author would like to thank his colleagues in Keysight’s Autonomous Drive Emulation team for support – especially Christian Bourde and Sven Leitsch, along with extra thanks to Bernhard Holzinger for supplying the vehicle target data.
References
Radar monitoring of bird migration
Radar return signal strength equation, “Introduction to radar systems”, 3rd edition, Merrill I. Skolnik, McGraw-Hill, 2002.
Friis formula, see, e.g., Chapter 12 in “Fields and Waves in Communication Electronics”, S. Ramo, J.R. Whinnery, and T. Van Duzer, John Wiley & Sons, 1965.
More on signal strength variability, “Analysis of Multipath and DOA Detection Using a Fully Polarimetric Automotive Radar”, T. Visentin et al., Proc. of 14th European Radar Conference, 11-13 October 2017, Nuremberg, Germany, pp 45-48.
Polarization dependence of interference versus range, figure a7
Gaussian beams, See, e.g., Chapter 6 in “Quantum Electronics”, 2nd edition, Amnon Yariv, John Wiley & Sons, 1975.
More on object classification, “Radar-detection based classification of moving objects using machine learning methods”, V. Nordenmark and A. Forsgren, Master of Science Thesis MMK 2015:77 MDA 520, KTH Industrial Engineering and Management, Machine Design, SE-100 44 Stockholm, Sweden.


