Measurements on public networks at our facilities demonstrate how 5G’s lower latency compared to LTE can improve industrial applications.
5G ultra-reliable low latency (URLLC) use cases are generally associated with automotive and industrial applications that include sending control commands to a mobile robot or automated guided vehicle (AGV). These applications depend on stable, reliable, and always available communication links with low latency to achieve fast reactions.
3GPP, the responsible standardization committee for 5G New Radio (NR), provided performance results as part of its self-evaluation reports including comprehensive performance data, which include latency results. The data shows round-trip delays for both downlink and uplink directions within the cellular network. Those delays are based on simulations using a small, fixed packet size data transmission, generally not identical to the applied data rates in deployed networks. Do real-life networks deployed today perform as promised? To find out, we made some measurements.
Most public 5G networks deployed so far use the 5G non-standalone (NSA) architecture, anchored with LTE networks. Here, we report our measurement results for both one-way latency (OWL) and round-trip time (RTT) delays in a commercially deployed, public 5G NSA network. Additionally, we compare those with LTE latency performance at the same locations. We made all measurements around the Rohde & Schwarz site in Munich, Germany. Table 1 lists the frequency bands deployed in the area. We used a Samsung S20 device with a commercial Deutsche Telekom SIM card, providing access to LTE and 5G services. The smartphone used our QualiPoc Android measurement app. (ARFCN stands for Absolute Radio Frequency Channel Number.)
| Network | Duplexing | Band | DL-AFRCN (CF) | UL-AFRCN (CF) | BW (UL & DL) |
| LTE | FDD | b1 | 475 (2157.5 MHz) | 18475 (1967.5 MHz) | 15 MHz |
| FDD | b3 | 1300 (1815 MHz) | 19300 (1720 MHz) | 20 MHz | |
| FDD | b7 | 3050 (2650 MHz) | 21050 (2530 MHz) | 5 MHz | |
| FDD | b8 | 3749 (954.9 MHz) | 21749 (909.9 MHz) | 5 MHz | |
| 5G NR | FDD | n1 | 431554 (2157.8 MHz) | 393560 (1967.8 MHz) | Up to 20 MHz |
| TDD | n78 | 642554 (3653.3 MHz) | 642554 (3653.3 MHz) | Up to 100 MHz |
Table 1. Frequency bands and channels that were allocated during measurements.
With respect to OWL, we used a prototype with connected GPS resources at the transmitting and receiving ends.
Latency depends on the data service (packet size and transmission interval). Typical tests use Ping measurements with 32-byte packets, which is not reflecting a real application. Therefore, our measurements apply data rates of 100 kb/sec, 1 Mb/sec, and 15 Mb/sec. The results reveal a clear data rate impact to the latency performance.
As expected, we noticed lower latency with 5G NR compared to LTE. Most of the improvements occur in cellular uplink (UL) direction for packets sent from the source in the user device through the radio access and core network to the receiving entity in the server. Latency increases as data rates increase, with generally significantly better performance in downlink (DL) than in uplink (UL). Best case 5G NR measurements revealed less than 7 msec OWL in DL for a 100 kb/sec data rate service. Worst case 5G NR measurements showed around 18 msec OWL in UL for a 15 Mb/sec data service.
Cellular network and measurement campaign
We analyzed latency at several locations. Measurements included interactivity test measurements, which measures round-trip-time (RTT) as well as one-way latency (OWL) measurements that let us measure delay on the UL and DL direction separately. Although we performed initial measurements in locations with 5G NR network coverage, we turned off the phone’s 5G capabilities to compare 5G to LTE. Table 1 provides an overview of LTE and 5G frequencies we identified in the coverage area.
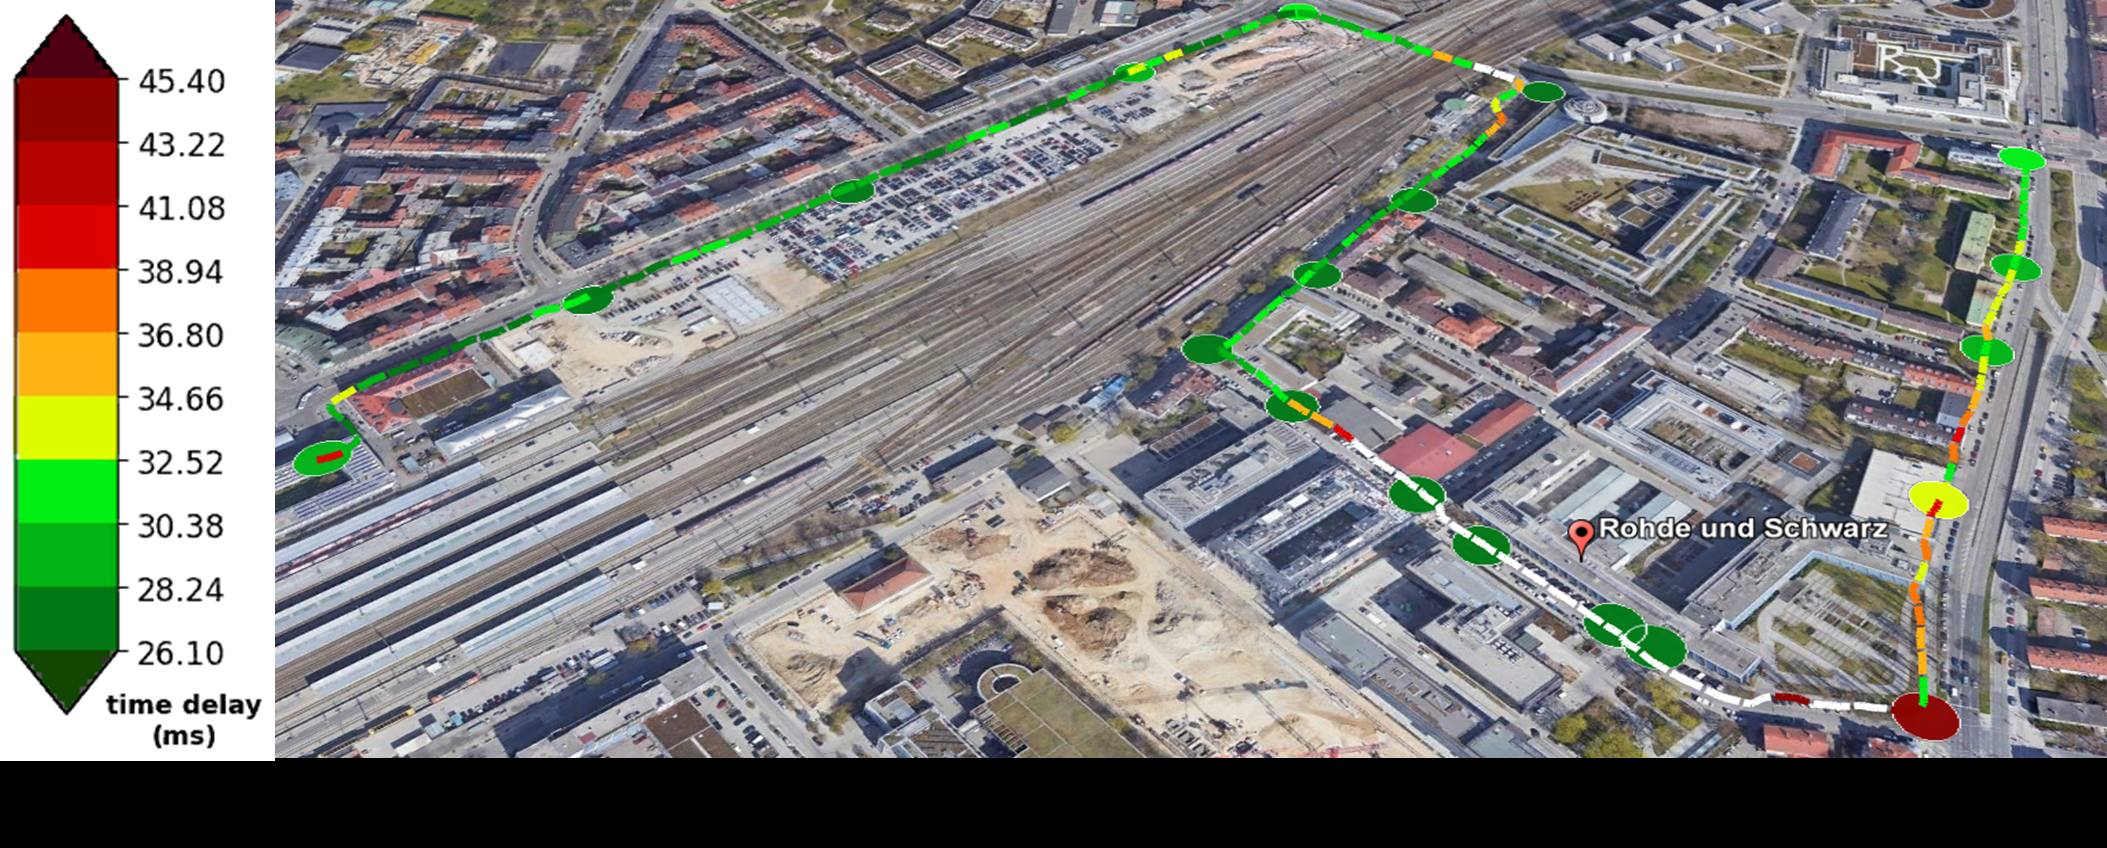
Figure 1. 5G NR measurements (RTT) in the “high” traffic load pattern. (Click image to enlarge.)
Figure 1 shows measurement area showing initial 5G NR RTT results. The colors indicate latencies at their locations.
We ran a scouting phase and multiple measurement campaigns, i.e. initially getting a basic understanding of coverage and latency performance and subsequently executing campaigns at the most reliable location that allowed both LTE and 5G NR measurements.
The QualiPoc Android tool enables sending data streams with the traffic characteristics as shown in Table 2.
| Traffic pattern | Packets per second | Packet size | Target bandwidth |
| Constant Low | 125 | 100 bytes | 0.1 mb/sec (0.47%) |
| Constant Medium | 200 | 650 bytes | 1 Mb/sec |
| Constant High | 1300 | 1450 bytes | 15 Mb/sec |
Table 2. List of traffic load patterns used in the measurement campaign.
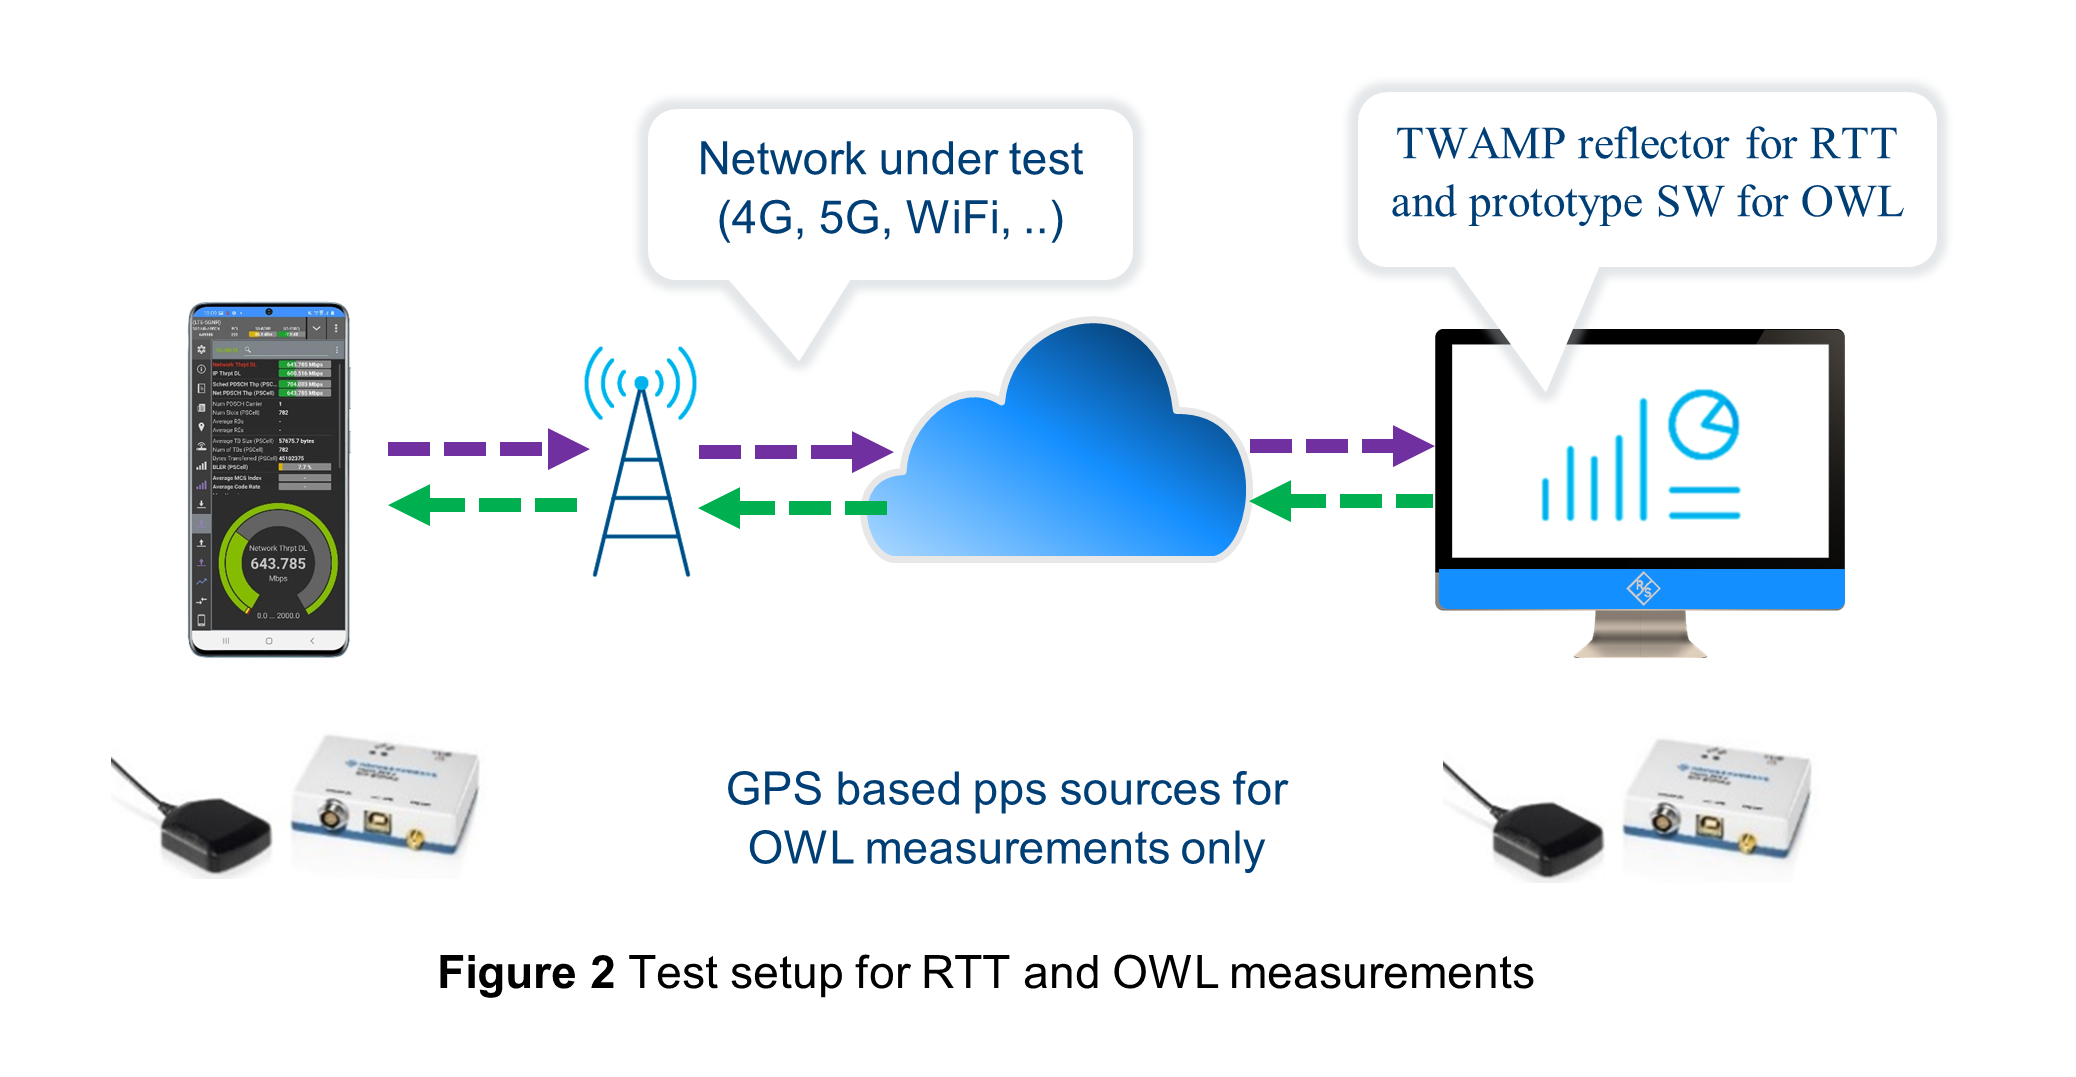
Figure 2. The test setup uses a smartphone app for RTT and OWL measurements. (Click image to enlarge.)
The packets send from the device are received and immediately reflected by a server using the Two-Way Active Measurement Protocol (TWAMP). The TWAMP server is located in one of the offices of Rohde & Schwarz accessible by a public IP address. Figure 2 illustrates the test setup. Note that although the focus of our campaign was to access LTE and 5G NR latency performance, the solution is agnostic to the underlying wireless technology. Figure 2 additionally describes the applied prototype test setup for OWL measurements. In this case, we used dedicated software on the server and the device for the tests. Furthermore, additional GPS sources at the transmitting and receiving end provide a pulse used during a pre-synchronization and during the actual measurement phase. Consequently, the OWL test duration is increased compared with the interactivity test. To ensure a fair comparison of RTT and OWL results, we concentrated on stationary tests.
Results
To illustrate the distribution of our data we chose a box plot representation (see Figures 4, 5 and 6). The box plots show not just the central tendency (median, mean and mode) but the data spread. Furthermore, box plots helped us identify the outliers inside our data sets. Based on statistics theory, outliers of a normal distribution correspond to 0.7% of the whole data. Outlier values in many cases indicate a measurement error, which we chose to exclude them from our results.
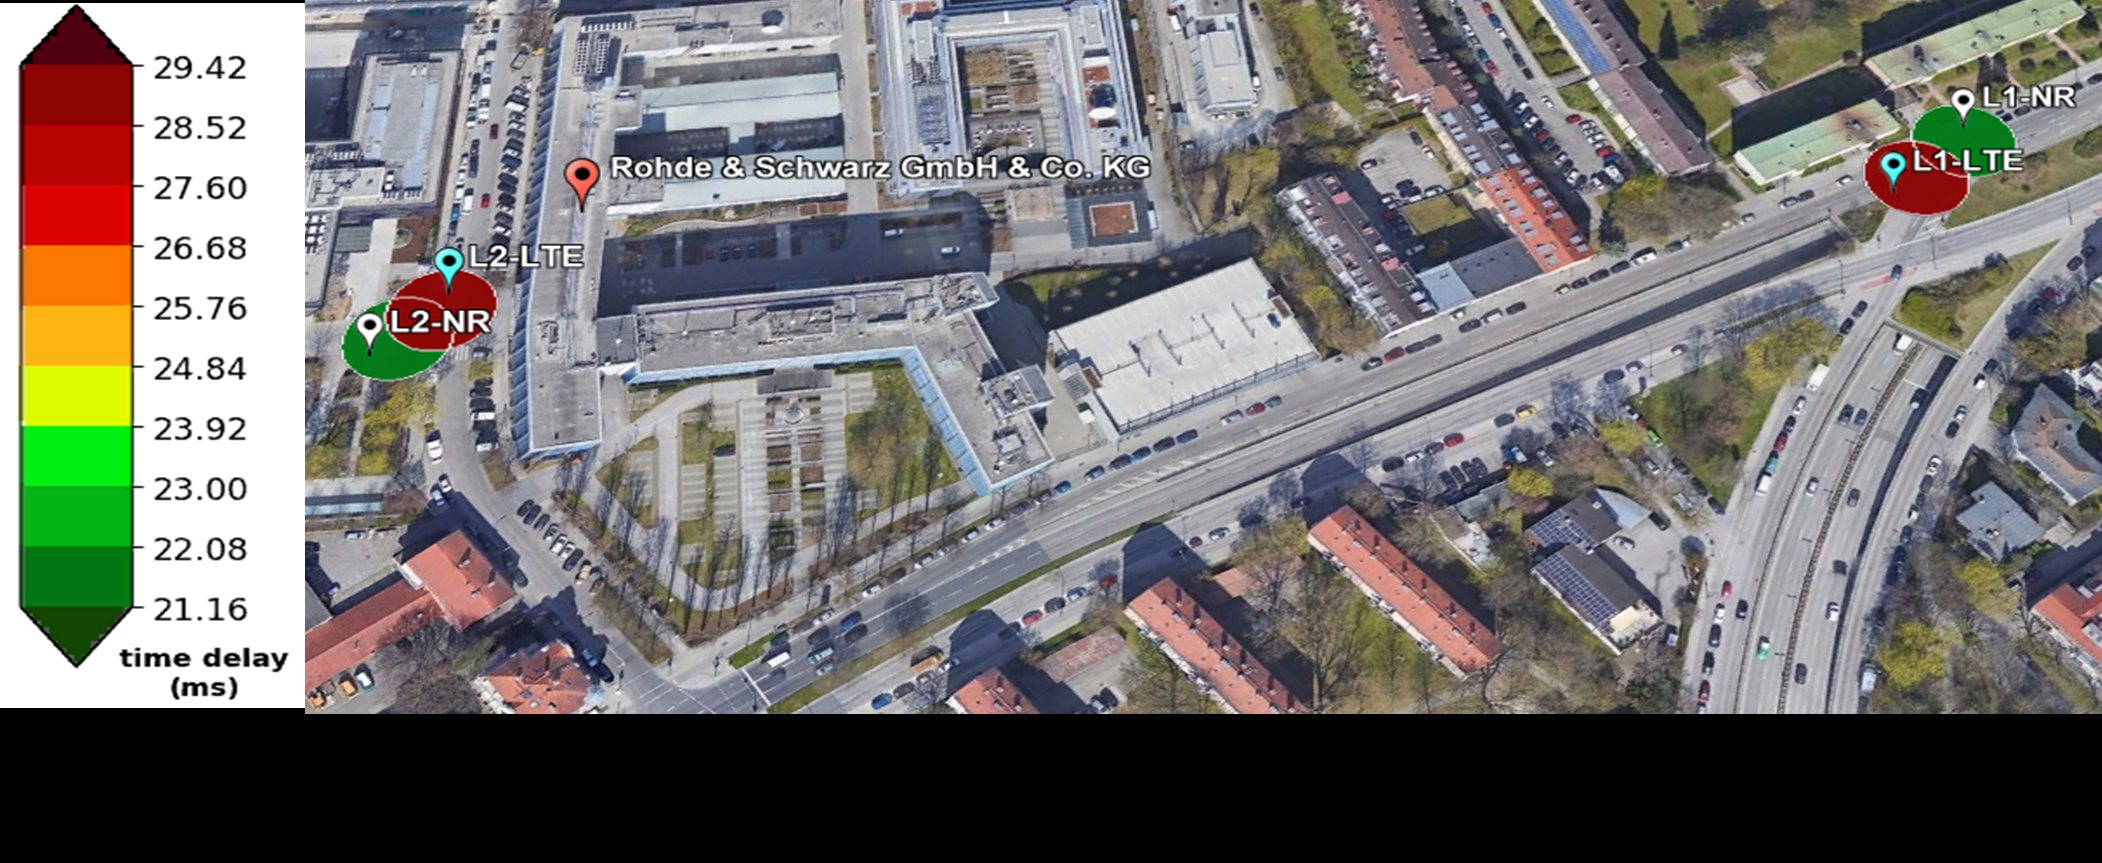
Figure 3. Locations of second Measurement Phase (map shows mean RTT values on “Medium” traffic load pattern of each location). (Click image to enlarge.)
We scouted the environment first and executed measurements at five different locations over several weeks and recorded comprehensive results. For this article, we concentrate on the LTE versus 5G NR comparison. For that reason, we decided on two locations, which provided us stable LTE and 5G NR results as shown in Figure 3.
Worth noting that it is expected that the sum of the OWL-UL and OWL-DL should not exceed the RTT delay since the RTT also includes additional delays within the server (reflections, processing time).
We merged all our NR data samples for these two locations (L1-NR, L2-NR) and all our LTE data samples (L1-LTE, L2-LTE) thus creating a large data set to get an averaged overview on the latency performance between 5G NR and LTE. We had not identified significant changes depending on the day of the week nor the time of the day measurements were executed. Figures 4, 5 and 6 show the overall results for the different data rate services respectively. Table 3 summarizes the latency performance improvement for all traffic patterns.
| Traffic | RTT improvement | Total OWL improvement | OWL-UL improvement | OWL-UL improvement |
| Low | 6.45 msec | 6.38 msec | 6.35 msec (99.53%) | 0.03 msec (0.47%) |
| Medium | 8.00 msec | 8.05 msec | 7.59 msec (94.29%) | 0.46 msec (5.71%) |
| High | 6.60 msec | 4.68 msec | 3.04 msec (64.96%) | 1.64 msec (35.04%) |
Table 3. Summary of the latency performance improvements based on median values that the 5G network provides compared to LTE.
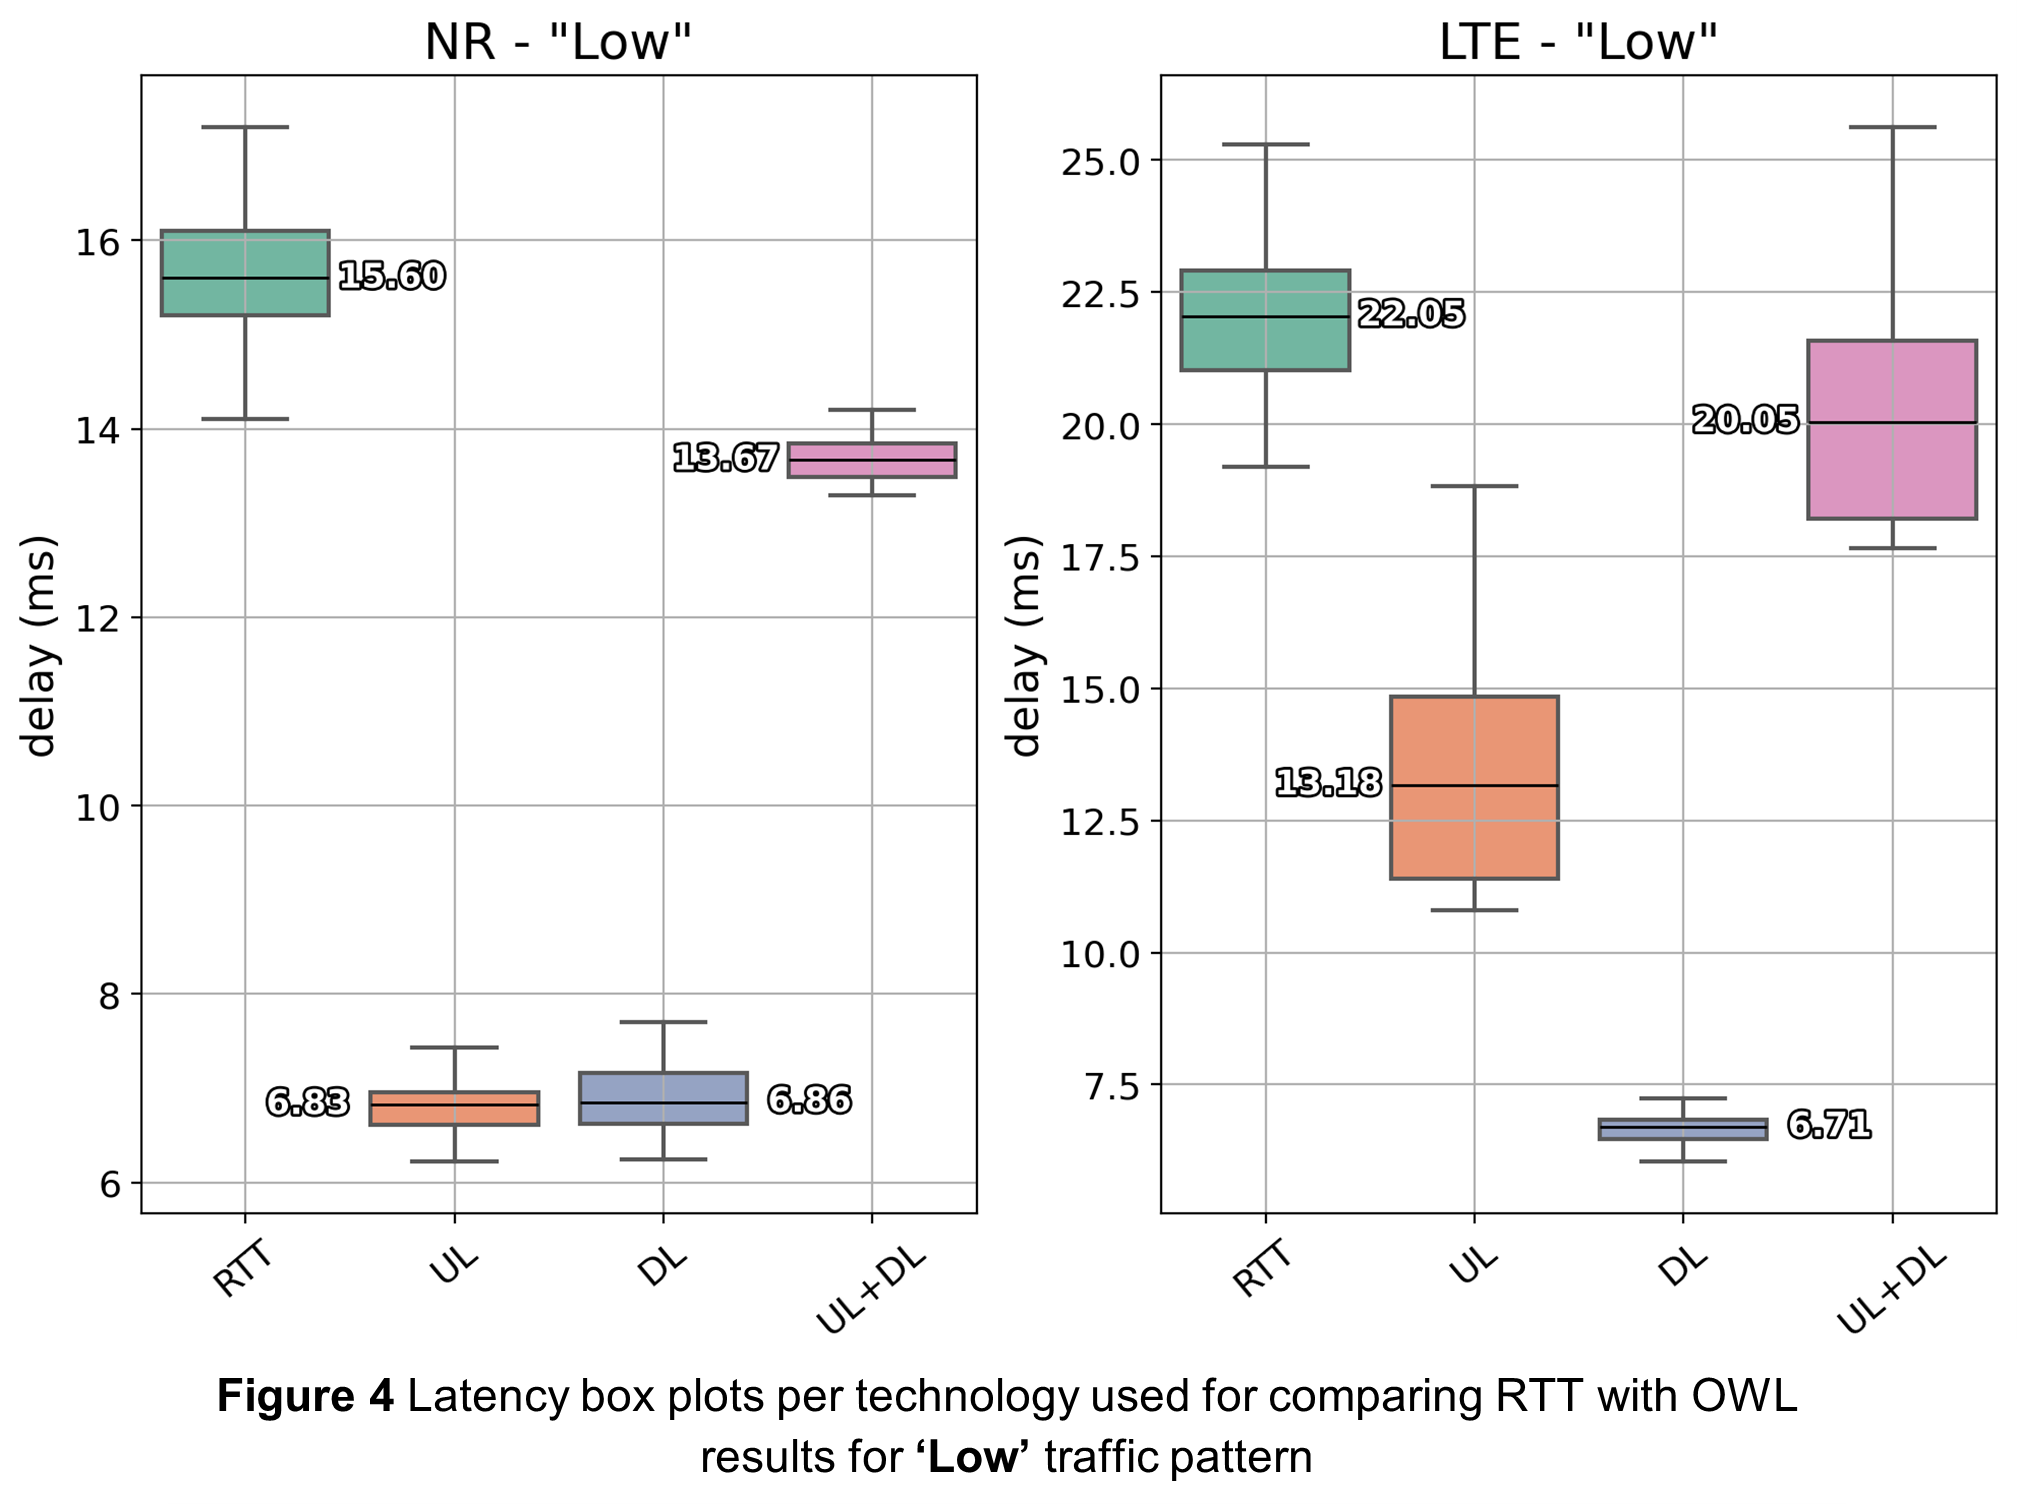
Figure 4. Latency box plots per technology used for comparing RTT with OWL results for “Low” traffic pattern. (Click image to enlarge.)
Conclusions and outlook
Upon completing the discussion on our measurement results, we ended up with several conclusions.
- In general, latency on the UL direction is higher than in the DL direction.
- The improvement that we get from 5G in terms of OWL latency is predominantly on the UL direction.
- In the high traffic load pattern, we get less overall OWL improvement compared to the RTT improvement.
- We notice more improvement on the DL direction as the traffic load increases.
- The RTT measurements are consistently higher compared to the sum of OWL-UL and OWL-DL reflecting the impact from a reflecting server.

Figure 5. Latency box plots per technology used for comparing RTT with OWL results for “Medium” traffic pattern. (Click image to enlarge.)
The presented analysis illustrates the results for an example commercially deployed network — measurements were executed in Munich in summer and fall 2021. 5G NR network deployment is an ongoing process, which may result into improvements due to increased coverage and additional capacity installed. We believe that latency performance is of particular interest in private 5G NR deployments, specifically if a private 5G network is used in an industrial environment to support use cases such as process automation, remote control of automation equipment or operation of mobile robots, and AGVs. In these deployments we expect better flexibility to adapt network settings to the target applications of interest. Rohde & Schwarz has deployed its own private 5G network in one of its manufacturing sites, namely in Teisnach, Germany. We will continue our measurement campaign in our own private 5G network and intend to present the results in a similar report.
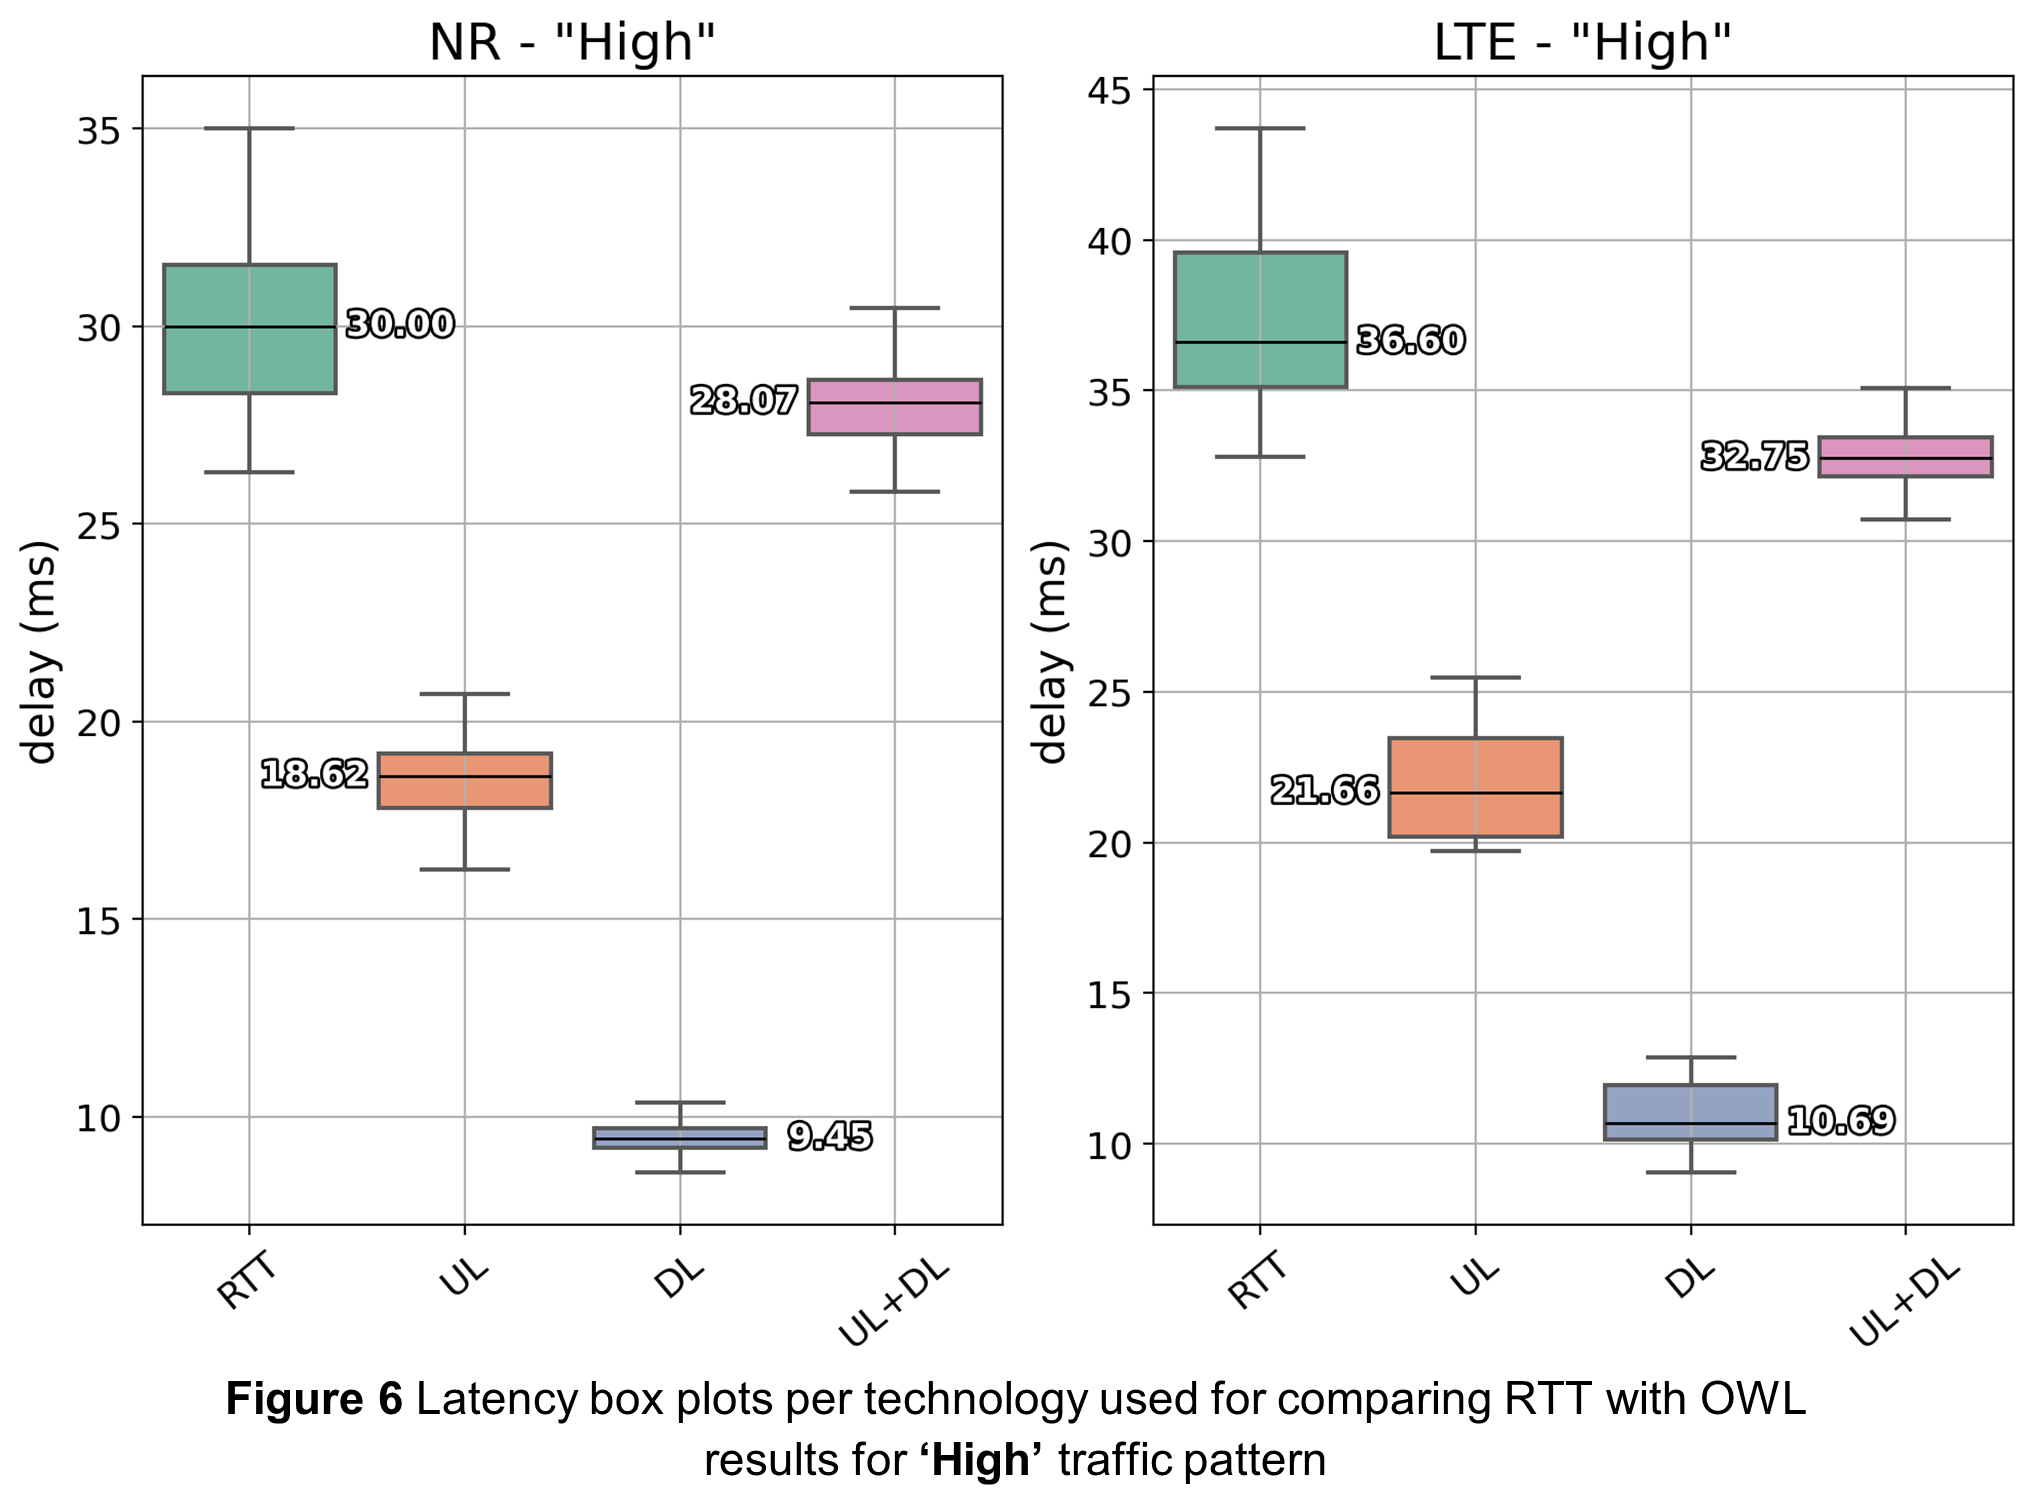
Figure 6. Latency box plots per technology used for comparing RTT with OWL results for “High” traffic pattern. (Click image to enlarge.)
 Meik Kottkamp has more than 25 years of technology experience in the cellular industry. He is Principal Technology Manager within the T&M market segment organization of Rohde & Schwarz in Munich. He is responsible for strategic marketing and product portfolio development covering the enhancements in existing and new 3GPP technologies. His focus is on 5G NR, specifically for industrial applications and the emerging beyond 5G technologies. Meik joined Rohde & Schwarz in August 2007 after working 11 years at Siemens and NSN, respectively. He holds a Dipl.-Ing. degree of electrical and microwave engineering from the Leibniz University Hannover, Germany.